| |
FP-plotter: A small
tool to generate F-P plots [download]
In one of our studies we observed how the
parameter control mechanisms in differential evolution (DE) work by the
fitness-parameter plot (F-P plot). The FP-plotter is a small tool for
you to generate F-P plots.
-
Installation
- Recommended environment:
gunplot (definitely required) + Windows + Code::Blocks (or Visual Studio)
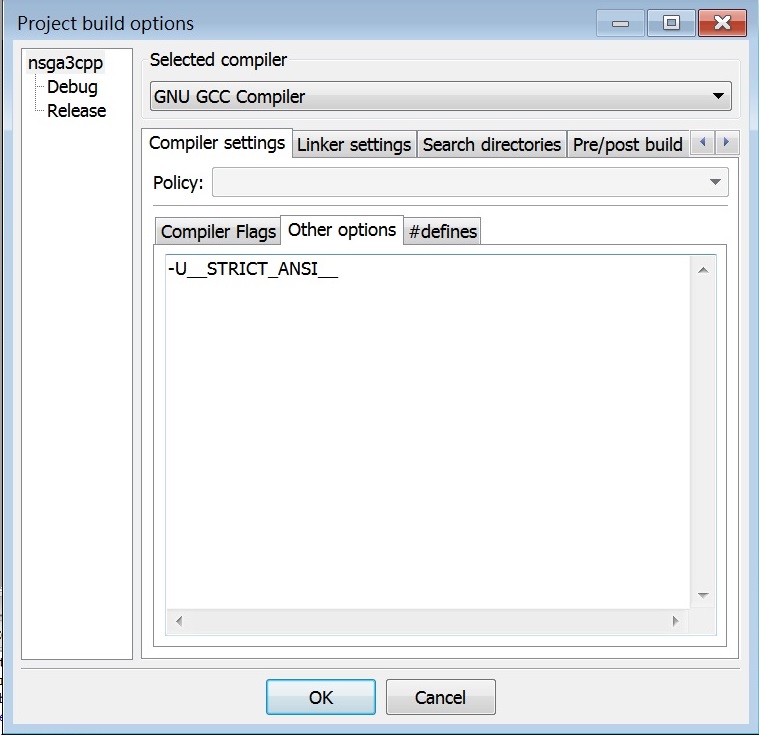
- If you want to build it with Code::Blocks,
please add "-U__STRICT_ANSI__" in
build options of the project.
- During the installation of gnuplot, please
let it set the path appropriately so that FP-plotter can call it.
-
File Preparation
-
For every single run of using your DE (e.g. jDE) to solve a certain
function (e.g. F1), output the following data into four separate
files:
-
jDE_F1_run1_F.csv:
F values used in mutation
-
jDE_F1_run1_CR.csv:
CR values used in crossover
-
jDE_F1_run1_Parents.csv: fitness values of parents
(target vectors)
-
jDE_F1_run1_Children.csv: fitness values of offspring
(trial vectors)
-
The format of each file is the same. Let's take a look at an example.
Assume that we run jDE with four individuals for two generations.
| jDE_F1_run1_Parents.csv |
jDE_F1_run1_F.csv |
jDE_F1_run1_CR.csv |
jDE_F1_run1_Children.csv |
Gen,ind1,ind2,ind3,ind4,
1,100,90,80,70,
2,80,90,80,50, |
Gen,ind1,ind2,ind3,ind4,
1,0.1,0.2,0.3,0.4,
2,0.1,0.2,0.3,0.4, |
Gen,ind1,ind2,ind3,ind4,
1,0.9,0.8,0.7,0.6,
2,0.9,0.8,0.7,0.6, |
Gen,ind1,ind2,ind3,ind4,
1,80,90,95,50,
2,0,0,0,0, |
In generation 1, we
take individual 1 (whose fitness is 100)
as the parent (target vector). The F value taken to
generate the mutant vector is
0.1. Then,
0.9 is used as
the CR value to generate the trial vector, i.e. the
offspring (whose fitness is
80).
Since the offspring is better (assuming minimization problem),
it replaces the parent.
- The download package already includes a
directory exp
containing a sub-directory
jDE with some data files. You can
run the program immediately to see what FP-plotter generates for
you.
- After running FP-plotter
with sample data files successfully, you should see several image files (.png).
If you do not understand the meaning of these plots, please refer to
our paper.
- What you have to do is to generate data
files in the above-specified format when carrying out your experiments. All
settings related to generation of the plots are in lines 26-39 in
main.cpp.
|
