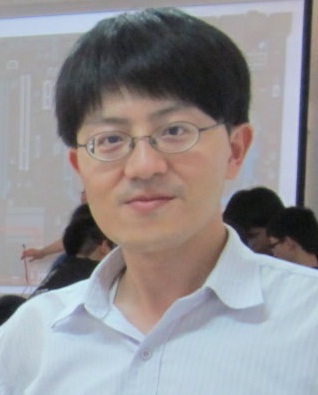
Associate Professor Tsung-Che Chiang
Department of Computer Science and Information Engineering
National Taiwan Normal University
Tel: +886-2-77346692 Fax: +886-2-29322378
Email

|
Associate Professor Tsung-Che Chiang |
 |
| ¡@ |
Chi-An Chen and Tsung-Che Chiang, Adaptive differential evolution: a visual comparison, Proc. of IEEE Congress on Evolutionary Computation (CEC), pp. 401 - 408, Sendai, Japan, May, 2015. (Presentation slides) Full text: Official version; Unedited version FP-plotter: It is a small tool for you to generating F-P plots. Abstract Differential evolution (DE) is a variant of the evolutionary algorithm and has good performance in solving continuous optimization problems. Two important parameters, F and CR, control the behaviors of the mutation and crossover operators in DE. Setting their values is critical, but the tuning process could be difficult and time-consuming. In the last decade, many adaptive DE have been proposed with various mechanisms to adjust the parameter values during the evolutionary process. Although these studies conducted numerical experiments and showed promising performance of the proposed algorithms, very few studies investigated and compared how the parameter values are adjusted by these algorithms. In this study, we compared six different types of adaptive DEs and observed their behaviors visually. Several interesting observations are made. The fitness-parameter-value plot (F-P plot) shows the evolutionary progress and the trial results of parameter values together. The following figure shows the FP-plot of SaDE for solving the Schwefel 1.2 problem in a single run. A black (resp. green) cross with coordinate (f, CR) means that use of the CR value generates an offspring that is better (resp. not better) than its parent with fitness f.
Here are the F-P plots for six adaptive differential evolution algorithms for solving the Schwefel 1.2 problem. More experimental results and findings can be found in the paper. ¡@
|
¡@